

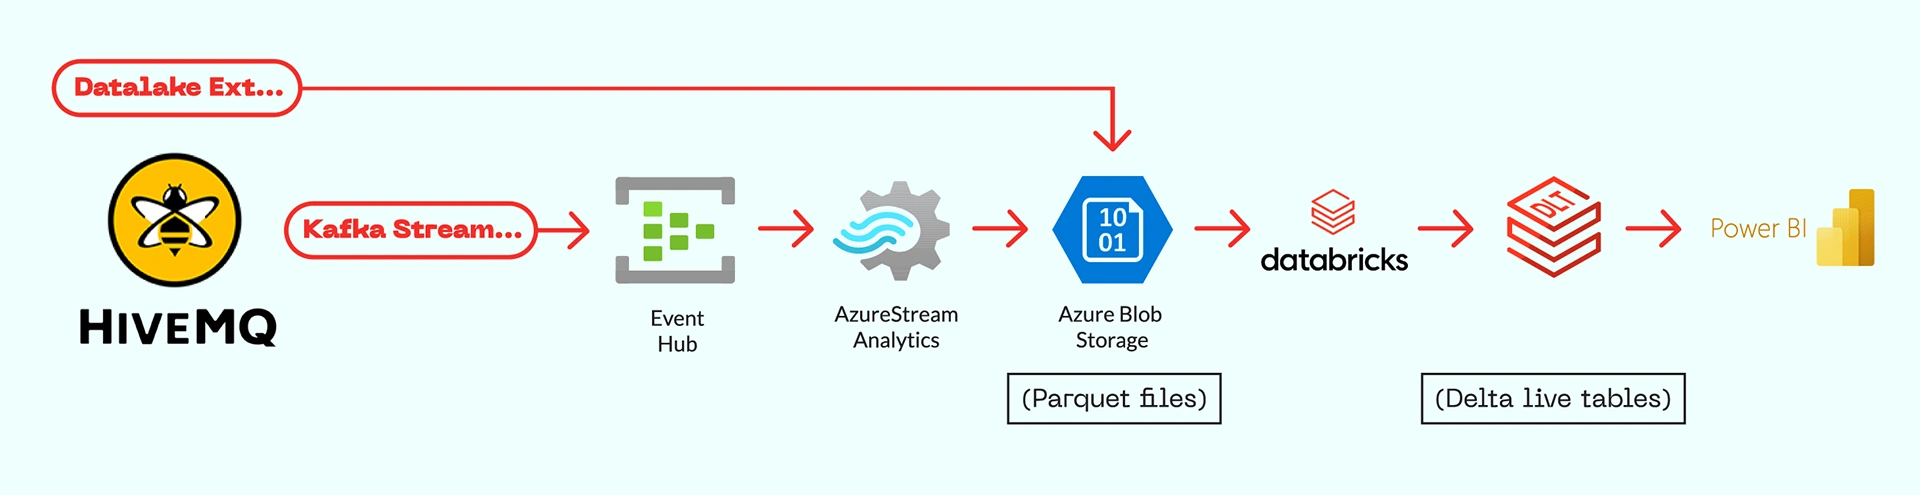
HiveMQ supports two ingestion paths into Azure: Datalake Extension for batch-based storage and Kafka Extension for real-time streaming

An ETL pipeline using Delta Live Tables transforms raw "bronze" data into structured silver or gold-level datasets ready for analytics.
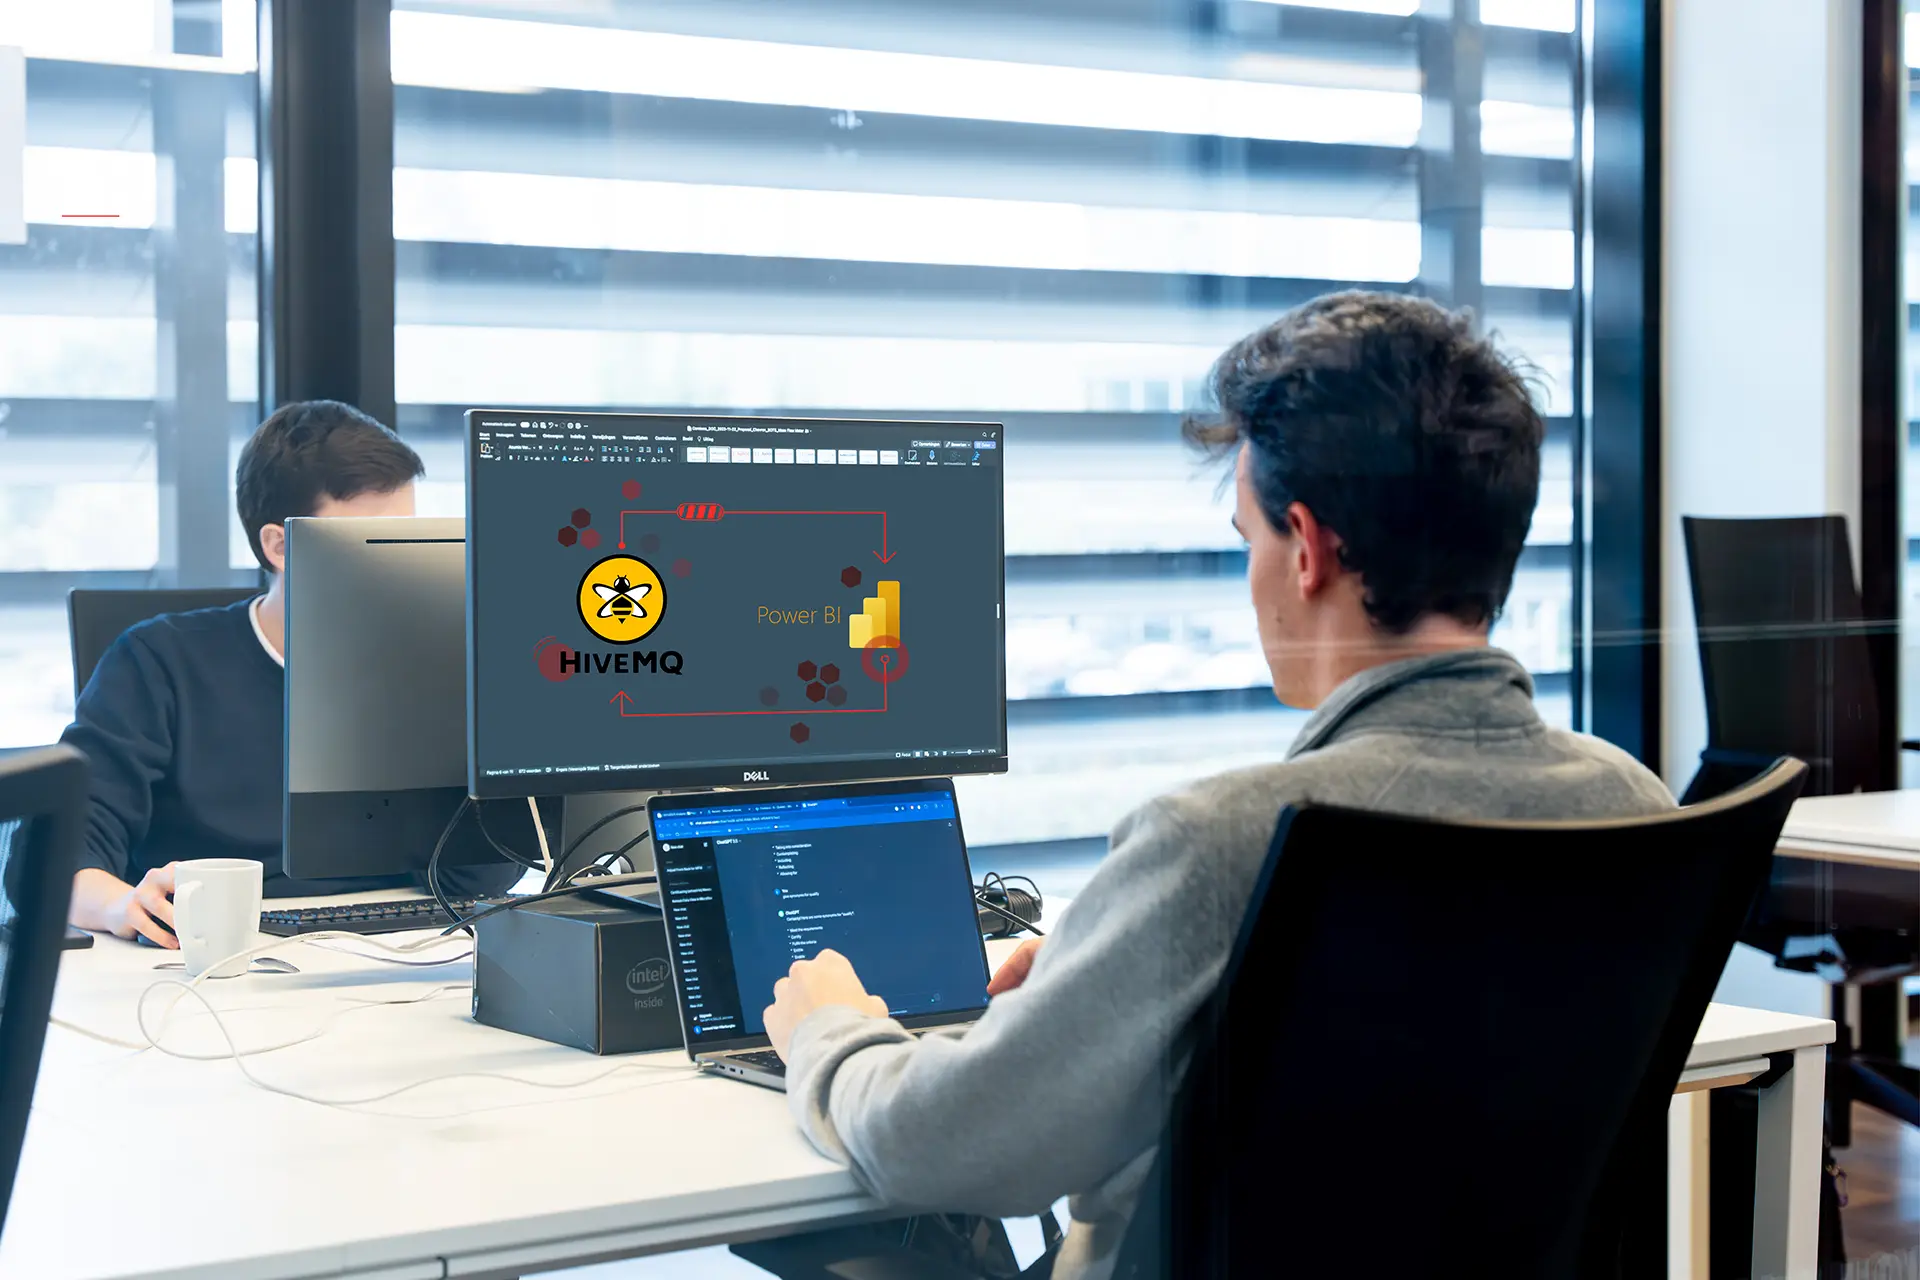
Databricks’ SQL Warehouse interface helps expose curated Delta Live Tables to Power BI, building a bridge between raw IoT data and business analytics


Fueled by


Turning MQTT messages into business-ready insights requires more than just a broker. It needs an end-to-end pipeline, from ingestion to transformation to visualization. At our company, we explored two main data flows to integrate HiveMQ with Azure and ultimately Power BI:
Both routes land data into Databricks for structured transformation before reaching dashboards in Power BI. The best choice depends on your use case—but also on cost, latency, and flexibility. An overview of both methods and their dataflow is shown below.
HiveMQ’s Datalake Extension makes it easy to capture MQTT traffic and store it directly as Parquet files in Azure. This setup is well-suited for historical analytics and periodic data exploration. However, there are two important caveats:
This makes it ideal for scenarios where latency isn’t critical, but structured archival and downstream transformation is required.
The Kafka Extension enables HiveMQ to forward MQTT messages in real time using the Kafka protocol. When connected to Azure Event Hub (on the Standard tier), this unlocks real-time streaming into the Azure ecosystem.
With Stream Analytics, incoming MQTT events can be instantly processed and written to Parquet files.
Compared to the Datalake Extension:
This architecture favors use cases that demand low-latency insights, operational monitoring, or alerting.
Whether data is ingested via the Datalake Extension or streamed through Event Hub, it ends up as raw Parquet files in Azure storage. These files are considered bronze-level data: they contain all events but are still unstructured and unfiltered.
In Databricks, we built an ETL pipeline using Delta Live Tables (DLTs) to process this data. This transformation step includes:
The output of this ETL is considered silver or gold-level data, ready for use in decision-making, analytics, and visualization tools like Power BI.
Once Delta Live Tables are created in Databricks, they can be exposed to Power BI through Databricks’ SQL Warehouse interface. This allows users to build interactive dashboards directly on curated datasets, without additional pipelines or exports.
The result is a seamless bridge between raw IoT data and business analytics: MQTT data flows from HiveMQ to Azure, gets enriched and structured in Databricks, and is visualized in Power BI. Whether you're monitoring factory conditions or generating reports on energy usage, this flow gives you the full picture, from edge to insight.
A key transformation that happens in Databricks is the pivot from narrow format to wide format:
Most ingestion pipelines (Kafka, Datalake) deliver narrow-format data. But BI tools like Power BI and Grafana work best with wide-format tables. The ETL step handles this reshape, making the data more intuitive and performant for end-users.
Both architectures are powerful. The Datalake Extension excels in simplicity and archiving. The Kafka Extension, on the other hand, brings real-time capabilities and a more flexible streaming pipeline—without requiring an expensive license.
For businesses looking to bridge industrial IoT with enterprise reporting, HiveMQ, Azure, and Databricks offer a robust and scalable stack.
Curious to see how this works with ignition as a base platform? You might want to check out our related article: "From Ignition to Power BI: Streaming IoT Data with Azure & Databricks"